Computer Science Capstone Design |
|
Visual and Auditory Processing of Neural Spike Trains |
NAU Biology |
|
||
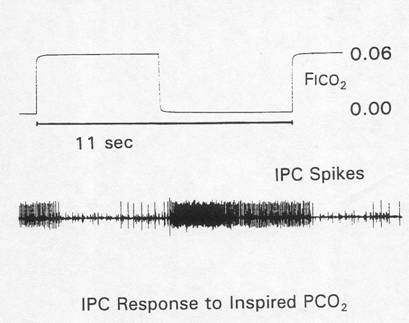
Project Overview:The proposed project is an application of computational neuroscience to sensory neurobiology. The task is to create a web-based program that reads experimentally obtained data files specifying (i) the times of occurrences of action potentials (spikes) generated by sensory neurons, and (ii) the time-varying amplitudes of physical stimuli sensed by the neurons. The desired output is an audio-visual screen animation of action potential firing with changing stimulus intensity. Multiple data files should be selectable by the user and overlaid as desired. This will permit modeling the parallel processing of sensory signals from a population of individually recorded neurons receiving the same stimulus. Histograms showing the time-varying probability of neuronal firing during the stimulus cycle should be generated in real time during file playback. Serial correlation of successive interspike intervals should be displayed in real time during data file playback. Desirable additional features would be calculation of the autocorrelation function of the sensory spike train, and calculation of the crosscorrelation function of the spike train with the sensory stimulus. General Background on Spike trains. Information transmission in the nervous system uses action potentials (nerve impulses, or "spikes") that are propagated along the axons of nerve cells. The information content in a train of neural spikes is carried in the timing of spike occurrences, like a digital system. All information sensed, computed and acted on by the nervous system of humans and animals depends on this type of spike train communication. For example, the information you perceive about this paragraph is transmitted from sensory neurons in your eyes to visual processing centers in your brain as spike trains. One of the great mysteries of neuroscience is exactly how information is encoded in spike trains, and how the brain interprets spike trains. This program will help visualize this process Specific Application. We want a web-based program that will produce visual and auditory representations of spike trains recorded from actual CO2 and O2 sensitive neurons (chemoreceptors) that control breathing. Humans and all air-breathing animals have chemoreceptor neurons that monitor CO2 and O2 levels in the body. These chemoreceptor neurons generate spike trains that provide negative feedback signals to the brain to control the depth and rate of breathing. We breathe to get rid of excess CO2 produced by metabolism and to take in O2 needed to metabolize food and produce energy. Sensory feedback from CO2 and O2 chemoreceptor neurons is absolutely necessary to sustain breathing and therefore life. An example of a spike train responding to CO2 is shown below: Failure of neural control of breathing leaves patients unable to breathe on their own, and dependent on mechanical ventilation. Breathing (respiratory) failure severely reduces quality of life and puts the patient in imminent danger of death. Unfortunately, failure of CO2 chemoreception is a common complication of congestive heart failure, emphysema, chronic bronchitis, and chronic obstructive pulmonary disease: all are major killer diseases in the US. Failure of O2 chemoreception is a severe risk factor in newborn premature humans, and is a significant risk factor for SIDS (sudden infant death syndrome). These diseases are huge public health problems and each year cost billions of dollars to treat in the US alone. Much could be learned about possible treatment of these diseases with analysis of neural feedback from CO2 and O2 sensitive chemoreceptor neurons coupled to experimental pharmacological treatment. |
||
|
||
|
||
|