|
Northern Arizona University |


|
Modeling/Analysis 1 |
|
In order to ensure that the final design thrust reverser is capable of meeting all of the requirements and specifications for this project, several forms of analysis had to be conducted. The analysis of the final design thrust reverser includes fluid mechanics and heat transfer using FloWorks, structural analysis using Finite Element Analysis (CFD), a mathematical analysis, and a kinematic analysis using Mathcad.
Fluid Mechanics Analysis using FloWorks A majority of the initial analysis was done using the Computational Fluid Dynamics program (CFD) Cosmos FloWorks. This program can model fluid flow through the actual engine as well as when it exits and hits the thrust reverser. The modeling of the engine, although not required in the requirements from our customer, proved to be quite useful as a learning tool. The reference book for the jet engine, Model Jet Engines Third Edition by Thomas Kamps gave the thermodynamic data at different regions of the engine, specifically useful was the data coming out of the exhaust flow. This data is calculated at max engine rpm and power. So with a thrust of 50N at 100,000rpm, the exhaust data is 300m/s at 600°C with a density of ρ=0.42kg/m^3. The single stage turbine and radial compressor is spinning at 100,000rpm, much higher than larger engines which are around 10,000rpm, because the breaking of the sound barrier causes problems in most engines. This data gave a final answer that enabled a check to make sure the FloWorks analysis came out with a similar result and had the proper boundary conditions. After updating the engine model on SolidWorks, as many of the original SolidWorks parts supplied were incorrectly dimensioned as well as having many parts missing, a FloWorks analysis could be run. A FloWorks analysis showing the fluid flow through the jet engine is shown below.
The engine was set to have a flow rate of 0.18kg/s as specified in the reference book. Heat was added to the 6 fuel sticks as combustion cannot be modeled in FloWorks. The amount of heat given off by the engine sticks was found converting the amount of energy given off by JP1 jet fuel as recommended by the author of the reference book Thomas Kamps. The specific energy of JP1 is 43.3MJ/kg, and when calculated with a fuel consumption of 9oz/min as given by the reference book at full throttle, gives an energy value of 107kW. So this final number was divided by 6 to determine how much energy each fuel stick gives off. These boundary conditions give an accurate result to within about 5°C after running for about 4 hours on a computer with 4, 2.4Ghz processors running with 2GB of RAM. Many hours prior to finding the solution were spent learning the program to even be able to run it accurately.
FloWorks Analysis of Fluid Flow through the Jet Engine
|
|
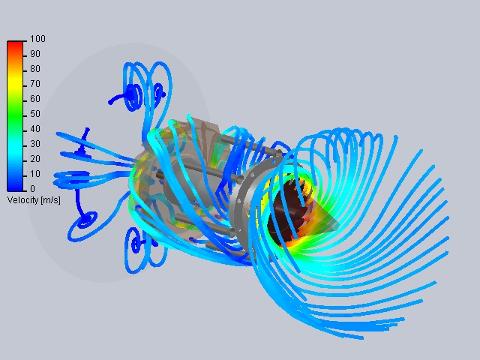
A velocity profile shows the predicted path of the exhaust air flowing out of the engine. The exit velocity after exiting the outer cone is 300m/s as given by the reference book by Thomas Kamps. The red is high velocity flow and the blue low velocity flow. This gives an idea of how the velocity being redirected from the thrust reverser slows down quickly as it exits. The above profile goes from 50m/s, red, to 0m/s, blue.
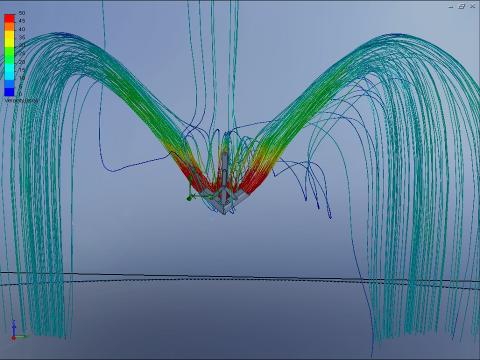
This profile really shows the difference between early designs and the final design. The first two iterations of the design had a lot of air just glancing off to the sides of the thrust reverser due to a high pressure bubble that appeared in the bottom of the clamshell. This was just wasted air that could have been redirected. The final design redirects virtually all of the air coming out of the engine creating much more redirected thrust. The two figures below show an up close view of the velocity profile against the thrust reverser and the velocity profile against the thrust reverser from a distance.
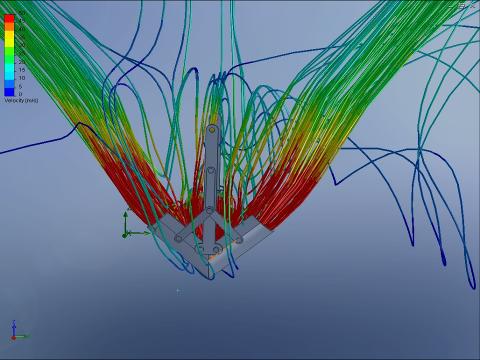
These figures give a good idea of what happens to the air when the aircraft is landing as the airflow going over the thrust reverser is 15m/s. That is why the air curves off after it leaves the thrust reverser. This is important to know not so much for the thrust reverser team right now, but for designers of the aircraft as it has not yet been made. This will be important information to find the right placement of the engine on the aircraft and how it will affect handling of the aircraft. Also, if the designers would like to deploy this while flying even though it has not been analyzed for that capability, this data could be used when at low speeds.
Up Close View of the Velocity Profile against the Thrust Reverser
Velocity Profile against the Thrust Reverser from a Distance
Heat Transfer Analysis using FloWorks It was important to analyze the heat profile of the interior of the engine. The rear of the engine is on the right, with a blue exhaust cone, and the front of the combustion chamber is on the left. The outer casing and other parts were hidden for clarity. The six sticks is where the heat from combustion is taking place, the red color is high temperature and as it turns from yellow to green to blue it is decreasing in temperature.
Temperature Profile of the Jet Engine
FloWorks was used to determine the temperature effects on the thrust reverser. Before this software could be implemented, it was first necessary to resolve the boundary conditions for the exhaust temperature. The figure below depicts the general temperature profile of the exhaust for the jet engine. This temperature profile is very general and a more detailed analysis of the temperature was required. Therefore, multiple iterations in FloWorks analysis had to be used. In addition, the flow conditions from the engine were used. Since the thrust reverser was going to be mounted very close to the exhaust of the jet engine, the temperature could vary between 550°C and 600°C. To resolve this, it was decided to use the worst case maximum exhaust temperature, which is 600°C.
Exhaust Temperature Profile
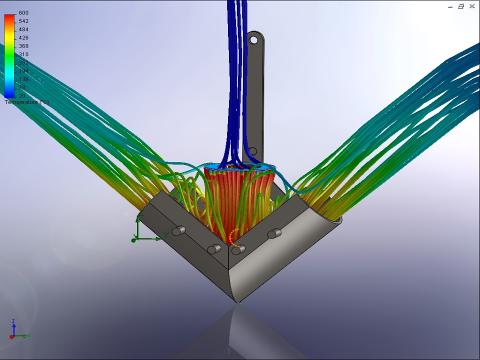
The fluid flow trajectory shows the temperature of the exhaust air as it comes out of engine as shown in the form of a ring, and redirects and cools down as it hits the thrust reverser. The red is hot, fast moving air at 600°C at 300m/s. The air cools down quickly as it leaves the thrust reverser and goes into the ambient air of 20°C. The temperature profile closely matches that of the velocity profile shown earlier in the report.
Temperature Profile of Fluid Flow against the Thrust Reverser
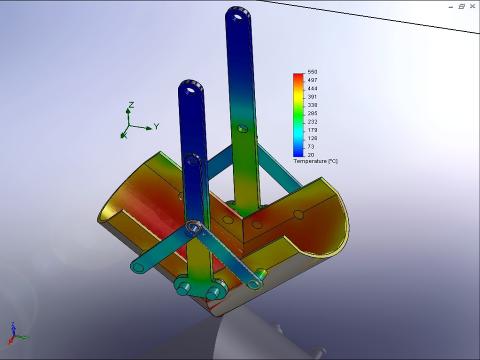
As mentioned previously, the boundary conditions used for the above heat profile of the thrust reverser was exhaust flow of 600°C at 300m/s. The points of the interest from the heat profile are the aluminum linkage system and the stainless steel reverser plates. For the reverser plate, stainless steel was chosen because of its yield strength at high temperatures. The yield strength for Stainless Steel 316 is 100 MPa at 600°C, which gives a factor of safety of 4 using a stress analysis. This is acceptable because the thrust reverser plates will be directly affected by the exhaust and exhaust particles which could further weaken the material. The other concern was with the 6061-T6 aluminum linkage section as shown by two vertical and four flat 45° flat beams. Aluminum was used to reduce weight and make manufacturing easier than the 316 Stainless Steel found on the buckets. The disadvantage with aluminum is that it has a lower melting point compared to steel and weakens at lower temperatures. Using an output spreadsheet from FloWorks, the highest temperature reached by the aluminum linkage is 399°C. The yield strength of aluminum at this temperature is reduced from 275MPa to 50MPa. This gives a factor of safety of 2 because the max stress encountered is 24.3MPa.
Heat Profile of the Thrust Reverser |